Statistic Inference
This is a Python base notebook
Using
rpy2for R functions
We saw some pattern in EDA, naturally, we would like to see if the different between feature are significantly related to the target.
Import libaries
import rpy2
import rpy2.robjects as robjects
from rpy2.robjects.packages import importr
%load_ext rpy2.ipython
%%R
library(tidyverse)
library(broom)
library(GGally)
R[write to console]: ── Attaching packages ─────────────────────────────────────── tidyverse 1.3.1 ──

R[write to console]: ✔ ggplot2 3.3.5     ✔ purrr   0.3.4
✔ tibble  3.1.6     ✔ dplyr   1.0.7
✔ tidyr   1.1.4     ✔ stringr 1.4.0
✔ readr   2.1.1     ✔ forcats 0.5.1

R[write to console]: ── Conflicts ────────────────────────────────────────── tidyverse_conflicts() ──
✖ dplyr::filter() masks stats::filter()
✖ dplyr::lag()    masks stats::lag()

R[write to console]: Registered S3 method overwritten by 'GGally':
  method from
  +.gg   ggplot2
Reading the data CSV
Read in the data CSV and store it as a pandas dataframe named spotify_df.
%%R
spotify_df <- read_csv("data/spotify_data.csv")
head(spotify_df)
R[write to console]: New names:
* `` -> ...1
Rows: 2017 Columns: 17
── Column specification ────────────────────────────────────────────────────────
Delimiter: ","
chr  (2): song_title, artist
dbl (15): ...1, acousticness, danceability, duration_ms, energy, instrumenta...

ℹ Use `spec()` to retrieve the full column specification for this data.
ℹ Specify the column types or set `show_col_types = FALSE` to quiet this message.
# A tibble: 6 × 17
   ...1 acousticness danceability duration_ms energy instrumentalness   key
  <dbl>        <dbl>        <dbl>       <dbl>  <dbl>            <dbl> <dbl>
1     0      0.0102         0.833      204600  0.434         0.0219       2
2     1      0.199          0.743      326933  0.359         0.00611      1
3     2      0.0344         0.838      185707  0.412         0.000234     2
4     3      0.604          0.494      199413  0.338         0.51         5
5     4      0.18           0.678      392893  0.561         0.512        5
6     5      0.00479        0.804      251333  0.56          0            8
# … with 10 more variables: liveness <dbl>, loudness <dbl>, mode <dbl>,
#   speechiness <dbl>, tempo <dbl>, time_signature <dbl>, valence <dbl>,
#   target <dbl>, song_title <chr>, artist <chr>
Regression
Data Wrangle
Remove
song_titleandartistfor relationship study by regression. As both of them are neither numerical nor categorical features.
%%R
spotify_df_num <- spotify_df[2:15]
head(spotify_df_num)
# A tibble: 6 × 14
  acousticness danceability duration_ms energy instrumentalness   key liveness
         <dbl>        <dbl>       <dbl>  <dbl>            <dbl> <dbl>    <dbl>
1      0.0102         0.833      204600  0.434         0.0219       2   0.165
2      0.199          0.743      326933  0.359         0.00611      1   0.137
3      0.0344         0.838      185707  0.412         0.000234     2   0.159
4      0.604          0.494      199413  0.338         0.51         5   0.0922
5      0.18           0.678      392893  0.561         0.512        5   0.439
6      0.00479        0.804      251333  0.56          0            8   0.164
# … with 7 more variables: loudness <dbl>, mode <dbl>, speechiness <dbl>,
#   tempo <dbl>, time_signature <dbl>, valence <dbl>, target <dbl>
Set up regression model
Here, I am interested in determining factors associated with target. In particular, I will use a Multiple Linear Regression (MLR) Model to study the relation between target and all other features.
%%R
ML_reg <- lm( target ~ ., data = spotify_df_num) |> tidy(conf.int = TRUE)

ML_reg<- ML_reg |>
    mutate(Significant = p.value < 0.05) |>
    mutate_if(is.numeric, round, 3)

ML_reg
# A tibble: 14 × 8
   term      estimate std.error statistic p.value conf.low conf.high Significant
   <chr>        <dbl>     <dbl>     <dbl>   <dbl>    <dbl>     <dbl> <lgl>
 1 (Interce…   -0.313     0.206    -1.52    0.128   -0.717     0.09  FALSE
 2 acoustic…   -0.325     0.055    -5.92    0       -0.433    -0.217 TRUE
 3 danceabi…    0.415     0.078     5.33    0        0.262     0.568 TRUE
 4 duration…    0         0         4.08    0        0         0     TRUE
 5 energy       0.09      0.093     0.974   0.33    -0.092     0.272 FALSE
 6 instrume…    0.268     0.044     6.05    0        0.181     0.354 TRUE
 7 key          0.001     0.003     0.334   0.739   -0.005     0.007 FALSE
 8 liveness     0.098     0.07      1.4     0.162   -0.039     0.236 FALSE
 9 loudness    -0.023     0.005    -4.81    0       -0.033    -0.014 TRUE
10 mode        -0.035     0.022    -1.58    0.113   -0.078     0.008 FALSE
11 speechin…    0.816     0.121     6.74    0        0.579     1.05  TRUE
12 tempo        0.001     0         1.95    0.052    0         0.002 FALSE
13 time_sig…   -0.009     0.042    -0.205   0.838   -0.091     0.074 FALSE
14 valence      0.165     0.051     3.24    0.001    0.065     0.265 TRUE
We can see that a lot of features are statiscally correlated with target. They are listed in the table below.
%%R
ML_reg |>
    filter(Significant == TRUE) |>
    select(term)
# A tibble: 7 × 1
  term
  <chr>
1 acousticness
2 danceability
3 duration_ms
4 instrumentalness
5 loudness
6 speechiness
7 valence
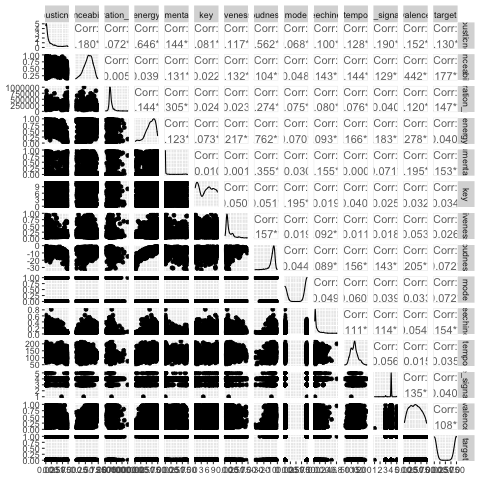
GGpairs
Below is the ggpair plots to visual the correlation between different features.
%%R
ggpairs(data = spotify_df_num)